Logan Flood Map 2025: How to Check Your Flood Risk
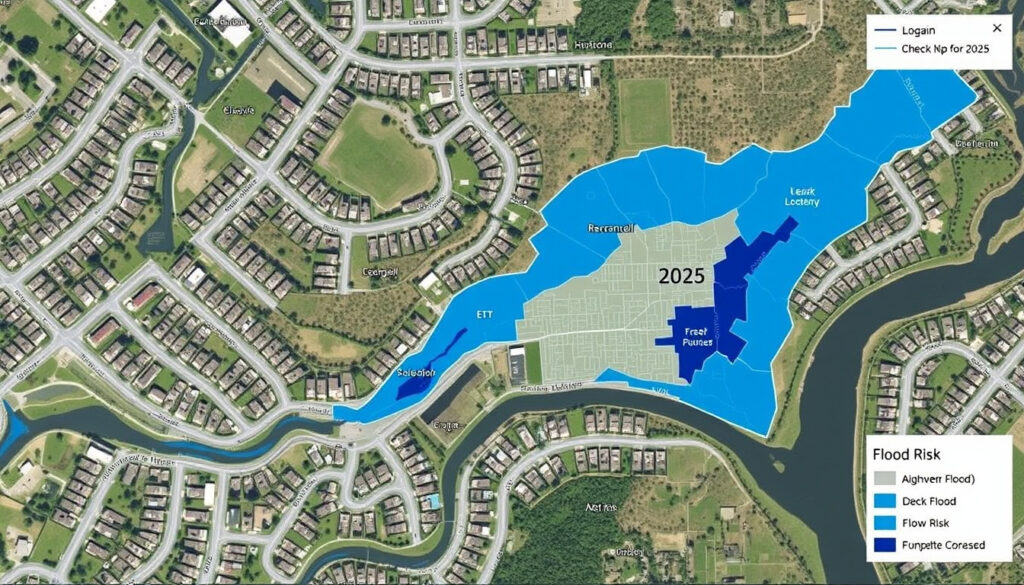
Logan is no stranger to flooding, with thousands of homes in the floodplain and flood maps being updated to reflect the latest science. In May 2025, Logan City Council accepted new flood studies covering four major creek catchments and commissioned an independent review after community feedback.
Council area: Logan, Queensland ·
Latest flood study release: May 2025 ·
Maximum flood event modelled: 1 in 2,000 year annual chance ·
Interactive mapping tool: Logan Flood Portal
Quick snapshot
- Logan City Council provides the Logan Flood Portal with official flood zone data.
- Maps are based on studies modelling up to a 1-in-2,000 year flood event (Council fact sheet).
- The Logan River flows from the Great Dividing Range to Moreton Bay (Wikipedia).
- Exact impact of climate change on future flood frequencies in Logan.
- Whether Google Maps flood layer will include Logan in the future.
- Timeline for completion of the independent review launched November 2025.
- 2015: Logan Planning Scheme flood overlays established (Council flood maps page).
- May 2025: New flood studies accepted for Flagstone Creek, Priest Gully, and Schmidts Creek (Council timeline).
- November 2025: Council commissions independent review of mapping changes (Council statement).
- Independent review to report back to Council on flood map methodology. (Council advice)
- Updated property flood reports expected after review completion (Council advice).
- Homeowners should check the Logan Flood Portal periodically for updates. (Council advice)
Five key facts summarise the current state of flood mapping in Logan:
| Field | Value |
|---|---|
| Council | Logan City Council |
| Latest flood study | May 2025 |
| Flood event modelled | Up to 1 in 2,000 year AEP |
| Interactive portal | Logan Flood Portal |
| Catchment area | Logan Albert Rivers (3,000 km²) |
Does it flood in Logan?
Understanding flood risk in Logan
- Logan is prone to flooding along the Logan River and its tributaries, including the Albert River, Flagstone Creek, and Priest Gully (Logan City Council flood maps page).
- The council provides flood mapping to help property owners understand potential flood risk (Logan City Council).
- Development is still possible on most mapped properties, even where flood mapping applies (Council statement).
Flood risk is real in Logan, but mapped doesn’t mean undevelopable. Council explicitly says most properties can still be built on, subject to appropriate flood-resistant design.
Recent flood study updates (2025)
- On 12 May 2025, Logan City Council accepted new flood studies for Flagstone Creek, Sandy Creek, Priest Gully, and Schmidts Creek catchments (Council fact sheet).
- These studies updated flood risk scenarios up to a 1-in-2,000 year annual exceedance probability event (the same Council fact sheet).
- Because of significant community feedback, Council commissioned an independent review of the mapping changes in November 2025 (Council flood maps page).
The implication: the 2025 updates are not the final word. Homeowners in the affected catchments should stay tuned for the independent review’s recommendations.
Where does the Logan River start and end?
The Logan River catchment area
- The Logan River begins in the Great Dividing Range near Mount Barney, Queensland (Wikipedia).
- It flows east through the Scenic Rim and Logan regions before emptying into Moreton Bay (Wikipedia).
- The catchment covers approximately 3,000 km², including major tributaries such as the Albert River (Wikipedia).
- This geography is key to predicting flood behaviour: heavy rain in the upper catchment can cause rapid rises downstream in Logan suburbs.
Why this matters: the entire Logan area drains to this one river system. If you live anywhere near the Albert or Logan Rivers, you’re in the same watershed.
How to check flood in Google maps?
Using Google Maps flood layer
- Open Google Maps on your desktop or mobile device.
- Search for a location in Logan.
- Click the “Layers” icon (stacked diamonds) in the bottom-left corner.
- Select “Flood” from the menu, if available. Note: this layer is not yet consistently rolled out for Logan (Google FloodHub indicates global forecasts are provided, but local precision may be limited).
- For reliable local data, use the Logan Flood Portal instead.
Google FloodHub as an alternative
- Visit flood-hub.app (Google’s global flood forecasting platform).
- Enter an address or coordinates in Logan.
- View current flood forecasts and historical data. Note: the tool provides broad warnings, not property-level zoning.
- For official flood risk zones, always cross-check with council mapping.
The catch: Google’s tools are useful for general awareness, but they don’t replace the council’s legally recognised flood maps. Always start with the Logan Flood Portal for decisions that affect insurance or property purchase.
What zone has the highest flood risk?
FEMA flood zone classifications
- In the US system, FEMA’s Zone A (Special Flood Hazard Area) carries the highest risk — properties have a 1% annual chance of flooding (100-year flood) (ClimateCheck).
- Zone V (Coastal High Hazard) is similarly high-risk for coastal areas.
- Zone X (shaded) has moderate risk (0.2% annual chance); Zone X (unshaded) has low risk.
Australian equivalents
- Australia uses different designations: floodway (highest risk, where water flows fast and deep), flood fringe (lower risk, slower water), and land subject to inundation (Logan City Council).
- Logan’s maps show modelled flood depths and velocities, not just zones. This gives a more granular picture than the US A-X system.
The pattern: floodway zones in Logan are the equivalent of FEMA’s high-risk A zones. If your property is in a floodway, expect the strictest development controls.
What are the flood zones in FEMA maps A-X?
Understanding the A through X zones
- Zone A, AE, AH, AO: 1% annual chance flood zones, with different base flood elevation details. A is approximate, AE has precise elevation (ClimateCheck).
- Zone V, VE: Coastal high-risk with wave action (1% annual chance).
- Zone X (shaded): 0.2% annual chance (500-year flood).
- Zone X (unshaded): Minimal flood risk.
Relevance to Logan and Queensland
- Logan City Council does not use FEMA zones, but the principles are similar: high-risk zones (floodway) correspond to FEMA’s A zones, while flood fringe resembles shaded X (Logan City Council).
- Understanding FEMA helps if you’re comparing international resources or insurance terminology.
- For Logan properties, rely on the council’s own flood mapping — available through the Logan Flood Portal.
What this means: unless you’re dealing with US-based insurance, stick with council maps. The FEMA system is a useful reference but doesn’t reflect Queensland’s flood behaviour.
Steps to check your property flood risk in Logan
- Go to the Logan Flood Portal (official council site).
- Search for your property address using the interactive map.
- View the flood study layers: depth, velocity, level, and hazard classification (Council fact sheet).
- Check the legend for floodway, flood fringe, or land subject to inundation.
- If you need a formal property flood report, contact Council directly (Council advice).
- For ongoing awareness, bookmark the portal and check after heavy rain events.
The independent review could lead to updated flood zones. If you’re in a newly mapped area, your insurance premiums and development options may change. Monitor council announcements in 2026.
The implication: following these steps ensures you have the most current data before making property decisions.
Timeline of Logan flood map changes
- 2015: Logan Planning Scheme flood overlays first established (Council flood maps page).
- May 2025: New flood studies released for Flagstone Creek, Sandy Creek, Priest Gully, and Schmidts Creek catchments (Council fact sheet).
- November 2025: Council commissions independent review of mapping changes after community feedback (Council statement).
The pattern: each update brings more precise data, but also community scrutiny.
What we know and what remains unclear
Confirmed facts
- Logan City Council provides flood mapping and reports via the Logan Flood Portal.
- Flood studies model up to 1-in-2,000 year events.
- Logan River starts in the Great Dividing Range and ends at Moreton Bay.
What’s unclear
- Exact impact of climate change on future flood frequencies in Logan.
- Whether Google Maps flood layer will include Logan in the future.
- Timeline for completion of the independent review.
“Council says development is still possible for most properties in the mapped area, even where flood mapping applies.”
— Logan City Council (official website)
“The Logan River is a perennial river located in the Scenic Rim and Logan regions of Queensland, Australia, with a catchment area of approximately 3,000 square kilometres.”
— Wikipedia
For Logan homeowners, the choice is clear: use the Logan Flood Portal to get authoritative data today, and keep an eye out for the independent review results in 2026. Ignoring your flood zone could mean higher insurance costs or surprises when you want to build — but with the right information, you can plan ahead.
scribd.com, data-logancity.opendata.arcgis.com, loganhub.com.au
If you’d like to understand how your local flood risk compares, you can also check the official Gold Coast flood map for nearby properties.
Frequently asked questions
What is the Logan Flood Portal?
An interactive online map provided by Logan City Council that shows flood study data, including depth, velocity, level, and hazard classifications for properties across the council area (Logan City Council).
How do I get a flood report for my property?
Use the Logan Flood Portal to view online data. For a formal report, contact Logan City Council directly (Council advice).
Are flood maps free to access?
Yes, the Logan Flood Portal is free to use online. There is no charge to view flood zone information for any address in the Logan area.
What does the flood map show (depth, velocity, level)?
The portal displays modelled flood characteristics such as depth, velocity, water level, and hazard classification for various storm scenarios (Council fact sheet).
How often are flood maps updated in Logan?
Maps are updated as new flood studies are completed. The most recent major update was in May 2025, with an independent review currently underway.
Does my home insurance require flood zone information?
Many insurers ask for flood zone data when calculating premiums. You can obtain your property’s flood classification from the Logan Flood Portal to share with your insurer.
Can I appeal my property’s flood zone designation?
Council has not published a formal appeals process, but the independent review launched in November 2025 suggests that community feedback can influence map updates. Contact Council to discuss if you believe your designation is incorrect.
Does the Logan flood map include current water levels?
No, the flood map shows modelled flood risk for future events based on various storm scenarios. For current river levels, check the Bureau of Meteorology website.
More related posts
 Beef Brisket Slow Cooker – Tender in 8-10 Hours
 David Harbour Allegations and Mental Health: What You Need
 Lithium Price Chart: Current Trends and 2026 Outlook
 Arshdeep Singh: Age, Stats, Height, Net Worth, and More
 Jane Remover: Biography, Music, Twin Rumors & FAQs
 Eden Sher: Sue Heck Actor’s Biography and Family
 Lenovo Idea Tab Pro – 2025 Full Specs Price and Review
 Air India Flight 171 Crash: 260 Dead, Mental Health Questions